NULL request with high CPU usage

thomasdk81

Verified User
Joined
Oct 3, 2010
Messages
56
Location
Denmark
Hi guys,

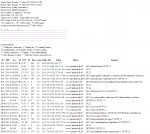
If you see my screenshot, you can see quite a lot of requests to server5.infoland.dk:80 (server hostname), using most of the CPU.
I get High CPU load alerts regular, but I can't see whats causing this.

I have mod_ruid2 so I would expect, the requests to belong to a user. So are these request, coming from the apache user, internal?

Its a VPS with 18 "real processor cores", 6Ghz dedicated CPU, 12GB ram and a 150GB SSD with a Gigabit connection.
With about 150 WordPress installs.

Can you point me in the right direction to whats causing this?
screenshot.png
screenshot-2.png
 
Last edited:
Thank you, a very nice tool and yes version 5 doesn't work.

I am still not sure why the apache user has the heavy CPU load.
The hits I see is regular hits and as I understand, should use the user which the host belongs to.
 
The thing about mod_ruid2 is that it swaps the user id of processes very quickly, often the child processes still use a lot of cpu after they're switched back from the user to apache. How this works exactly I don't know, but I'm quite sure this is how it's always happening. Only if the request it is handling takes very long the user will show up as the process user (just tested this myself with a large page and F5ing it).

Maybe if you have a lot of sites active, the load is just legit? If WP sites don't cache and have some plugins taking a lot of resources, that could just be it.

You could also try to switch to php-fpm, to see what that does and if certain users pop out that way.

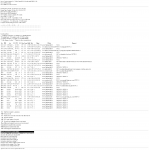
Taking a closer look to your screenshot, it does seem odd, as there are not many requests per second.
 
Thanks for the reply.

I don't know enough about this and you could be right.
The WordPress sites aren't tweaked with caching and I am sure this would help.
Maybe there is a plugin, thats poor coded.

screenshot-3.png

I'll try and find the source of it.
Any hints will be greatly appreciated.
 
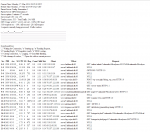
You can look at that status page, visit the sites you see there listed and hold F5 for a few secs, while also viewing the cpu usage (I can recommend htop).

See at which site the load goes the highest, maybe try different pages..

It may not be a decent way, but it may be an easy way to figure this thing out.
 
Thanks again :)

I use htop, another nice tool.
If I find a more efficient way I'll report it here.
 
I tried a new thing: ls -l /proc/7857/fd

This gives me the list of files, the process have opened.
The list is long but they are all .log .error.log .bytes files

So it seems like, its DA processes?
 
That's correct, there are always 3 files per domain, for /var/log/httpd

iirc, DA needs the bytes file to count the bandwidth used by the users

And the .log/error files are also available to the users inside DA under statistics.

But since this is normal, you need to continue looking elsewhere.
 
Back
Top