High cpu on user account, and high iowait.

Richard G

Verified User
Joined
Jul 6, 2008
Messages
14,100
Location
Maastricht
We are experiencing high cpu load from 1 user account which has multiple domains. Now from another post I created a way I can have a look at a status page to see what is going on. And then something like this is the output:
Code:
pid:                  2210802
state:                Idle
start time:           25/Nov/2024:14:08:43 +0100
start since:          489
requests:             28
request duration:     610655
request method:       GET
request URI:          /index.php?nocache=14-16-42&_=1732537468522
content length:       0
user:                 -
script:               /home/username/domains/somemusicsite.com/private_html/index.php
last request cpu:     91.70
last request memory:  27262976

So this one has no high cpu, but I'm wondering about the "start since" and "duration" values, is that normal, same for the last request memory? From another domain the request duration is even higher.

This one is from another of his domains, momentarily low cpu but also wondering about these values, very long duration time, or not?
Code:
pid:                  2211539
state:                Idle
start time:           25/Nov/2024:14:08:55 +0100
start since:          477
requests:             29
request duration:     989224
request method:       GET
request URI:          /index.php?add-to-cart=45358
content length:       0
user:                 -
script:               /home/username/domains/otherdomain.nl/private_html/index.php
last request cpu:     88.96
last request memory:  37748736

As you can see, idle now but last request cpu high.

This is his pool:
Code:
pool:                 username
process manager:      ondemand
start time:           25/Nov/2024:13:22:28 +0100
start since:          3264
accepted conn:        1421
listen queue:         0
max listen queue:     0
listen queue len:     0
idle processes:       7
active processes:     1
total processes:      8
max active processes: 13
max children reached: 0
slow requests:        0

Anybody a clue on where this high load is coming from?
Also, could the high load also be coming from disk issues or something? Disks look fine but we also got very high iowaits on that server if this user is busy. And I don't know how to get the iowaits lower.

CPU usage -> see image
Disk usage 12,8 %
RAM usage 9.46 % cached 33,74 %

But here you can very well see the high iowait.
afbeelding.png


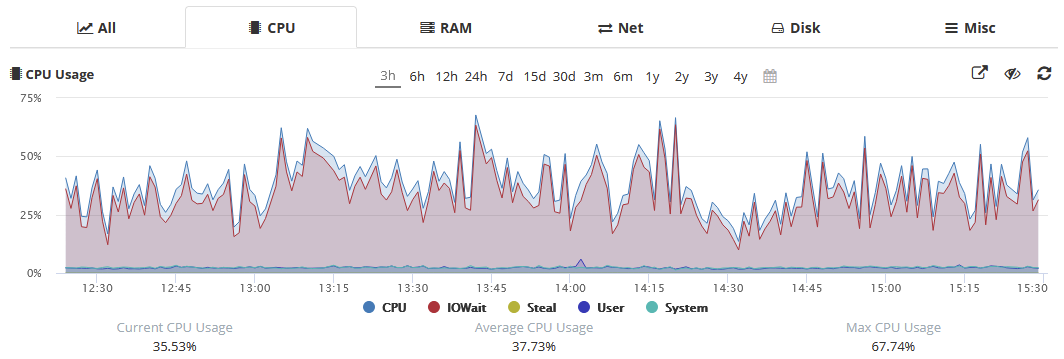
Looking at the colors one would say iowait and system is causing the high load. I don't know where to look anymore.
Odd thing is I don't see high loads on the php-fpm pools of other users when looking with "top c" in ssh.
 
The both domains of him or maybe all 3 would have big file cache. I use opcache on that server.
Doesn't seem to be overloaded.
afbeelding.png


afbeelding.png


But it is indeed his domains which are hitting all this when checking "scripts" and "visualize partition" tabs.
 
I meant.... their website cache system.

Like using "file_get_contents" to download local or external on the large files. this function will consume CPU resource if it's big file.
 
Phuu I have no clue but I don't think so, network usage might be higher due to a lot of visitors to the radio site:

I can only see a top C is like this:
afbeelding.png


Netwerk usage last 3 hours.

afbeelding.png
 
Offtopic :
Which gui is that you use with Opcahe and php?

edit
i found it, opcache-status
 
Last edited:
Yep, exactly. :)

If you find a way to switch between all present php-fpm versions, would be nice. I can only see the main one.
Unless I make 3 different files I guess.
 
Seems raid-check is still running, takes very long on this server, also causing high iowait.
Didn't happen like this before, but now every week when raid-check is running. However smartctl does not show errors.
 
@Richard G You are using hetrixtools right ? did you enable this:
1732554853420.png

You can do realtime monitoring on your raid and disk
 
You can do realtime monitoring on your raid and disk
I did enable that if I'm not mistaken. You are using that monitor? Do I have it in here? That is this, right?

afbeelding.png

This is the mdstat output at this moment.
[/code][root@server27: ~]# cat /proc/mdstat
Personalities : [raid1]
md0 : active raid1 sdb1[0] sda1[1]
67042304 blocks super 1.2 [2/2] [UU]

md2 : active raid1 sdb3[0] sda3[1]
1884198976 blocks super 1.2 [2/2] [UU]
[============>........] check = 64.5% (1217061632/1884198976) finish=484.4min speed=22949K/sec
bitmap: 5/15 pages [20KB], 65536KB chunk

md1 : active raid1 sdb2[0] sda2[1]
2070528 blocks super 1.2 [2/2] [UU][/code]
 
Yes. On another server (with SSD drives) I got 15. Reallocated sector counts.

On the server with the high load it's 8 reallocated sector counts and 1 Reallocated event count (total 9).
However, smartctl gives a "passed" on all drives.

Edit: FYI on both systems it's like that for a year, they did not increase.
 
Having the same trouble since the latest update:

2024-11-26_08-15.png

Big spikes in activity by DA users here:

2024-11-26_08-16.png

Zooming into a 15 minute timeframe yesterday when server load hit 40+, DirectAdmin itself is the pink spike here:

2024-11-26_08-18.png

Every day, a few times I get these huge spikes in CPU usage and disk i/o since 1.671. @fln anything you could think of?
 
@jayw1, this thread is about the high resource usage by the PHP process serving a request for the client website. It has nothing to do with the directadmin process. Please start a different thread for unrelated issues.
 
I don't think it's DA either.

@exlhost No we only have a backup-DNS VPS at Contabo. This is a dedicated server at Hetzner.

Probably it's the disks getting old or something. Today there are some but not csf messages about high load anymore.
And raid-check is ready now.
Server is visited a lot, but seems these issues are happening during raid-check, just remember last week monday it was the same and rest of the week it's fairly quiet. At least don't see a lot of mails about high loads.
 
Im almost sure it is a bat bot.

You could also try runing a previous version of the kernel. Youre running almalinux 9.5 ?
 
I doubt it's a bot, because I would have found that, also checked visitors logs from the user.
Also I don't understand what it has to do with the kernel. But this is the last server we got running on Almalinux 8.10.

That user still has spikes, but that radio site has loads of visitors, since the raid-check is ready, all is fine, so imho that points more to disk issues or load gets too heavy when raid-check and disk/io is both active.
 
Yes that's another site of the same user. It's that site and a radio site, both from the same user.
Because of the thread you referred to I was able to post those stats in my initial post here.
 
Back
Top