Richard G
Verified User
We are experiencing high cpu load from 1 user account which has multiple domains. Now from another post I created a way I can have a look at a status page to see what is going on. And then something like this is the output:
So this one has no high cpu, but I'm wondering about the "start since" and "duration" values, is that normal, same for the last request memory? From another domain the request duration is even higher.
This one is from another of his domains, momentarily low cpu but also wondering about these values, very long duration time, or not?
As you can see, idle now but last request cpu high.
This is his pool:
Anybody a clue on where this high load is coming from?
Also, could the high load also be coming from disk issues or something? Disks look fine but we also got very high iowaits on that server if this user is busy. And I don't know how to get the iowaits lower.
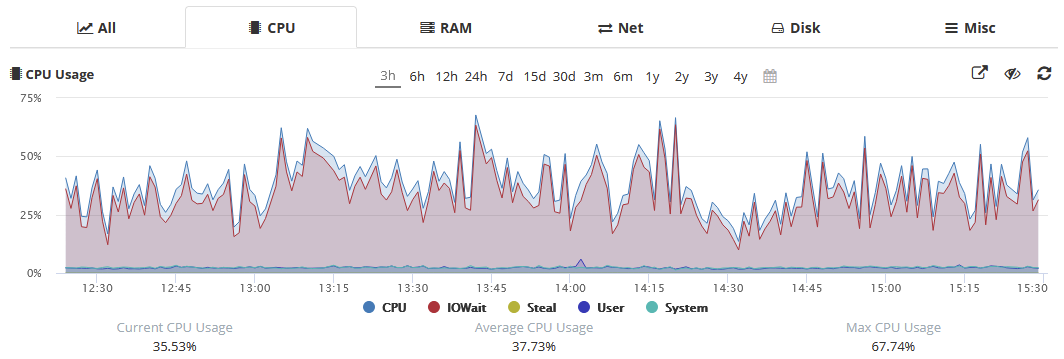
CPU usage -> see image
Disk usage 12,8 %
RAM usage 9.46 % cached 33,74 %
But here you can very well see the high iowait.

Looking at the colors one would say iowait and system is causing the high load. I don't know where to look anymore.
Odd thing is I don't see high loads on the php-fpm pools of other users when looking with "top c" in ssh.
Code:
pid:                  2210802
state:                Idle
start time:           25/Nov/2024:14:08:43 +0100
start since:          489
requests:             28
request duration:     610655
request method:       GET
request URI:          /index.php?nocache=14-16-42&_=1732537468522
content length:       0
user:                 -
script:               /home/username/domains/somemusicsite.com/private_html/index.php
last request cpu:     91.70
last request memory:  27262976
So this one has no high cpu, but I'm wondering about the "start since" and "duration" values, is that normal, same for the last request memory? From another domain the request duration is even higher.
This one is from another of his domains, momentarily low cpu but also wondering about these values, very long duration time, or not?
Code:
pid:                  2211539
state:                Idle
start time:           25/Nov/2024:14:08:55 +0100
start since:          477
requests:             29
request duration:     989224
request method:       GET
request URI:          /index.php?add-to-cart=45358
content length:       0
user:                 -
script:               /home/username/domains/otherdomain.nl/private_html/index.php
last request cpu:     88.96
last request memory:  37748736
As you can see, idle now but last request cpu high.
This is his pool:
Code:
pool:                 username
process manager:      ondemand
start time:           25/Nov/2024:13:22:28 +0100
start since:          3264
accepted conn:        1421
listen queue:         0
max listen queue:     0
listen queue len:     0
idle processes:       7
active processes:     1
total processes:      8
max active processes: 13
max children reached: 0
slow requests:        0
Anybody a clue on where this high load is coming from?
Also, could the high load also be coming from disk issues or something? Disks look fine but we also got very high iowaits on that server if this user is busy. And I don't know how to get the iowaits lower.
CPU usage -> see image
Disk usage 12,8 %
RAM usage 9.46 % cached 33,74 %
But here you can very well see the high iowait.

Looking at the colors one would say iowait and system is causing the high load. I don't know where to look anymore.
Odd thing is I don't see high loads on the php-fpm pools of other users when looking with "top c" in ssh.


