Solved High loading times without a high load

patrickkasie

Verified User
Joined
Sep 21, 2021
Messages
183
Location
Een echte Hollander
Dear DirectAdmin forum,

My VPS has decided to misbehave all out of a sudden. Or at least, a website that's running on the VPS. The pages with a low loading times are the ones that are simply plain text and nothing but a header and a few doodads. But when loading an article which contains a lot of pictures, all bits of speed just go down the drain. I've been unable to figure out what's causing it. Things to note:
The problem started happening yesterday since 4:00pm, but we didn't edit or even touch the website in any way.
A month prior, we've upgraded our VPS, giving us double CPU performance, storage and RAM.
The biggest folder contains 76GB of data inside it, but this was never an issue.

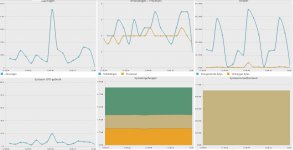
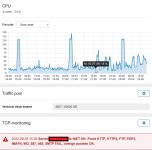
The graphs shown in the screenshots are from PHPMyAdmin and my VPS provider. On the PMA screenshot, I've refreshed the pages a couple of times and I'm not sure what to make of it. The 2nd shows when the issue started happening.

The message says: Server [REDACTED] is NOT OK: Port (ports) FAIL, other ports are OK
 

Attachments

  • chrome_0ukoDcu7vw.jpg
    chrome_0ukoDcu7vw.jpg
    125.8 KB · Views: 76
  • firefox_7UzMa62RM0.jpg
    firefox_7UzMa62RM0.jpg
    108.7 KB · Views: 61
Things I have tried that I should definitely add before hastily posting whatever is wrong with my server:
/var/log/messages: an IP4 and IP6 address that keep probing our server every single second which is already blocked in IPtables and csf.deny
All services restarted, server reboot
top shows nothing obvious when loading one of the heavier pages
top - 12:35:31 up 1:08, 1 user, load average: 0.01, 0.13, 0.31
Tasks: 221 total, 1 running, 220 sleeping, 0 stopped, 0 zombie
%Cpu(s): 1.2 us, 0.7 sy, 0.0 ni, 98.0 id, 0.1 wa, 0.0 hi, 0.0 si, 0.1 st
KiB Mem : 8008612 total, 5471984 free, 1324832 used, 1211796 buff/cache
KiB Swap: 1048572 total, 1047548 free, 1024 used. 6389060 avail Mem

PID USER PR NI VIRT RES SHR S %CPU %MEM TIME+ COMMAND
1904 mysql 20 0 1172688 383724 7288 S 1.3 4.8 12:41.88 mysqld
20200 apache 20 0 367112 29936 7004 S 1.0 0.4 0:01.34 httpd
19704 apache 20 0 409528 72816 6972 S 0.7 0.9 0:07.93 httpd
20361 apache 20 0 420432 84164 6888 S 0.7 1.1 0:08.79 httpd
20551 apache 20 0 361312 24664 6808 S 0.7 0.3 0:00.38 httpd
9 root 20 0 0 0 0 S 0.3 0.0 0:06.19 rcu_sched
678 root 20 0 0 0 0 S 0.3 0.0 0:01.49 xfsaild/dm-2
 
Check your system and apache logs for any errors or attacks on your server. If the speed remains very bad, you can ask if they want to place your VPS in another hypervisor.
 
In the Brute Force monitor, there does appear to be quite a larger than usual number of IP addresses that got PERMBLOCKed, and one of these IP addresses still try to access the server every second on /var/log/messages. But other than that, I'm not sure. The Apache access logs show normal usage, no weird number of clients trying to access multiple pages at the same time every second. I will request the company to place our VPS in another hypervisor and see if that fixes the problem
 
The VPS has been placed in another hypervisor at this point, and the speed has remained as terrible as it is, and the notification on the TCP monitoring notice has yet to see itself out the door. Not only that, google.com and www.google.com have been blocked in CSF. I have unblocked the IP addresses for now, but there must be a reason this addition has suddenly been made. We have added ReCaptcha V3 last week, which I only recall just now. What else can be done to get the VPS back up to speed? Removing that ReCaptcha isn't doing anything to improve the speed.
 
Watch your (h)top to see which user is responsible for the high cpu/ram
Most of the time these are WP sites that are attacked, if so install plugin like Wordfence and throttle the amount of max connections per minute
 
Please refer back to one of the earlier messages I've sent, as the top command hasn't shown anything useful at this time. Loading pages does not increase this load significantly.

htop
-bash: htop: command not found
top
top - 11:09:08 up 4 days, 23:41, 2 users, load average: 0.02, 0.11, 0.14
Tasks: 224 total, 1 running, 223 sleeping, 0 stopped, 0 zombie
%Cpu(s): 1.6 us, 1.0 sy, 0.0 ni, 97.2 id, 0.1 wa, 0.0 hi, 0.0 si, 0.1 st
KiB Mem : 8008612 total, 161156 free, 1397000 used, 6450456 buff/cache
KiB Swap: 1048572 total, 690944 free, 357628 used. 6170920 avail Mem

PID USER PR NI VIRT RES SHR S %CPU %MEM TIME+ COMMAND
8100 apache 20 0 378700 31968 9412 S 2.3 0.4 0:00.27 httpd
10161 mysql 20 0 1210444 479412 5236 S 1.7 6.0 222:37.87 mysqld
8057 apache 20 0 370296 108764 6336 S 1.3 1.4 0:01.17 httpd
7949 apache 20 0 284848 20480 4436 S 0.7 0.3 0:00.18 httpd
7981 apache 20 0 400968 54884 9696 S 0.7 0.7 0:01.05 httpd
8105 root 20 0 162380 2420 1596 R 0.7 0.0 0:00.04 top
435 root 20 0 0 0 0 S 0.3 0.0 3:06.32 xfsaild/dm-0
7803 apache 20 0 410584 64548 9676 S 0.3 0.8 0:01.13 httpd
8005 apache 20 0 325844 64076 6332 S 0.3 0.8 0:00.33 httpd
30059 root 20 0 176376 24180 2176 S 0.3 0.3 0:36.73 lfd - sleeping
1 root 20 0 191284 3020 1668 S 0.0 0.0 0:56.93 systemd
2 root 20 0 0 0 0 S 0.0 0.0 0:00.15 kthreadd
4 root 0 -20 0 0 0 S 0.0 0.0 0:00.00 kworker/0:0H

sar -r
08:30:01 AM kbmemfree kbmemused %memused kbbuffers kbcached kbcommit %commit kbactive kbinact kbdirty
11:10:01 AM 233896 7774716 97.08 0 6153796 3604952 39.80 1380780 5830600 56
11:20:01 AM 153036 7855576 98.09 0 6378488 3548268 39.18 3145396 4151484 40
 
Solution: My colleague made a coding whoopsie by trying to add 5 unique ReCaptcha forms and did a page request upon loading every single element in the screen, resulting in 1. slow loading times 2. blocking Google IP addresses on our side 3. dropping ping requests to our server. He made a check to ensure a form is filled and sent to our server before trying to load a bajillion things into oblivion. Thanks for thinking along, and despite being unable to provide an answer for obvious reasons, I hope this leaves those with an urge of solutions satisfied.
 
Back
Top