Hi all,
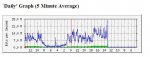
I need to adjust the graph value for Y axis. please refer to the picture.Currently it is showing 7.0 M..
how can i change them to show in bits
I got another question.
How can i configure MRTG to send email notification when threshold has reached the limit?
Thank you.
FYI: I am using MRTG to monitor a cisco router