Server Details:
- CPU: 6 cores
- RAM: 16 GB
- Hosted Pages: 2
Problem:
I am receiving a high load alert on my server:This is an automated message notifying you that the 5 minute load average on your system is 10.07.
This has exceeded the 5 threshold.
One Minute - 10.57
Five Minutes - 10.07
Fifteen Minutes - 8.55
top - 00:27:50 up 1 day, 1:59, 0 users, load average: 10.57, 10.07, 8.55
Tasks: 221 total, 11 running, 210 sleeping, 0 stopped, 0 zombie
%Cpu(s): 70.5 us, 27.3 sy, 0.0 ni, 0.0 id, 0.0 wa, 0.0 hi, 0.0 si, 2.3 st
MiB Mem : 15736.6 total, 12001.8 free, 2646.7 used, 1419.7 buff/cache
MiB Swap: 0.0 total, 0.0 free, 0.0 used. 13089.9 avail Mem
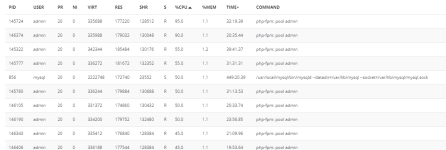
PID USER PR NI VIRT RES SHR S %CPU %MEM TIME+ COMMAND
93014 admin 20 0 326724 188624 17280 R 52.6 1.2 8:44.30 php-fpm: pool admin
93020 admin 20 0 297560 159960 17024 R 50.0 1.0 8:44.38 php-fpm: pool admin
93006 admin 20 0 326292 188404 16768 R 28.9 1.2 8:51.18 php-fpm: pool admin
93016 admin 20 0 324284 185944 16640 R 26.3 1.2 8:47.70 php-fpm: pool admin
93018 admin 20 0 301280 163604 16768 R 26.3 1.0 8:39.02 php-fpm: pool admin
93027 admin 20 0 324580 186620 17536 R 26.3 1.2 8:47.20 php-fpm: pool admin
93029 admin 20 0 326384 187560 16640 R 26.3 1.2 8:42.98 php-fpm: pool admin
92449 admin 20 0 304592 165724 16896 R 23.7 1.0 8:51.14 php-fpm: pool admin
93008 admin 20 0 321300 183656 17024 R 23.7 1.1 8:59.89 php-fpm: pool admin
93012 admin 20 0 310336 172300 17280 R 21.1 1.1 8:36.86 php-fpm: pool admin
856 mysql 20 0 2222448 169156 23552 S 2.6 1.0 216:59.04 /usr/local/mysql/bin/mysqld --datadir=/var/lib/mysql --socket=/var/lib/mysql/mysql.sock
93587 root 20 0 7636 3712 2944 R 2.6 0.0 0:00.10 /usr/bin/top -c -b -n 1
System Status:
CPU Usage:
Users: 70.5%
System: 27.3%
Memory:Total: 15736.6
MiBFree: 12001.8
MiBUsed: 2646.7
MiBBuff/cache: 1419.7
MiBSwap: 0.0 MiB (unused)
Main Processes:Multiple php-fpm processes from the admin pool are consuming a significant amount of CPU (around 50% each).The MySQL process is also consistently active, with many queries in "Sleep" state.