RAM usage after Backups

Michael.Terence

Verified User
Joined
Feb 15, 2009
Messages
59
I run DA (full license, not a vps license) on one of my Xen Virtual Machines... the VM has been allocated 4GB of RAM, and while running it uses about 2.5GB of said RAM. At 5am, however DA does its backups, and updates usage statistics... once this happens, RAM usage jumps up to 3.98GB and stays there.

I had a situation last week where the server started swapping, and crashed. I modified the VM this morning, and allocated 6GB of ram - it's been using 1.7GB of RAM all day... I'm curious to see what it jumps to @ 5am tomorrow morning.

I'll be sure to update the thread with the new RAM usage at that time.
 
What do you expect its gonna raise cpu and ram when moving alot of data....
 
well yeah...? But why doesn't the RAM get freed upon completion? Restartin DA, mysql, etc doesn't free it either. I'll investigate further tomorrow and see where exactly it's being held hostage.

This thread is an attempt to understand why this works the way it does and hopefully make DA a better product.
 
Michael,

You've got me wondering if that's what was causing my system to run out of memory from time to time (our private discussion). I don't think so, but it's possible. I'll keep watching as well.

Jeff
 
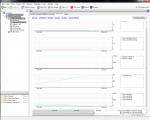
I just read your email Jeff, I'll definately keep an eye on things. This AM, backups started at 5:00am, and were complete at 5:04am. I assume DA continued to update usage statistics, etc - but what was it doing that would take 30 minutes, while disk reads/writes were low, bandwidth was almost nil, and CPU usage remained below 10%?

In the attached screenshot, CPU usage is in the top most graph, the rest are labled clearly. I can't see any reason for the backup/update procedure in DA to eat 4GB of RAM.
 

Attachments

  • DA_Ram_Issue.png
    DA_Ram_Issue.png
    123.7 KB · Views: 152
More Info:
Code:
[root@web1 ~]# free -t -m
             total       used       free     shared    buffers     cached
Mem:          6656       6152        503          0        436       5079
-/+ buffers/cache:        636       6019
Swap:         2000          0       2000
Total:        8656       6152       2504

Code:
[root@web1 ~]# vmstat
procs -----------memory---------- ---swap-- -----io---- --system-- -----cpu------
 r  b   swpd   free   buff  cache   si   so    bi    bo   in   cs us sy id wa st
 0  0      0 497428 446860 5213324    0    0    20    55  156  125  5  1 93  0  0

Code:
top - 08:00:22 up 22:06,  1 user,  load average: 0.10, 0.18, 0.17
Tasks: 116 total,   1 running, 115 sleeping,   0 stopped,   0 zombie
Cpu(s):  0.8%us,  0.0%sy,  0.0%ni, 99.2%id,  0.0%wa,  0.0%hi,  0.0%si,  0.0%st
Mem:   6815744k total,  6335600k used,   480144k free,   448612k buffers
Swap:  2048248k total,        0k used,  2048248k free,  5223196k cached
 
Install and start "htop", go into "Setup", "Display options", check "Hide userland threads", check "Highlight megabytes in memory counters" and click on "Done". Hit F6 and choose "MEM%", exit.

Next time you want to see which program is eating up memory, just run "htop" again.
 
Just a note that my system that was going crazy with resource usage has resolved the issue by doubling the memory from 1G to 2G.

It's been over a week, and there are no further problems.

So the issue wasn't the same.

Jeff
 
Back
Top