Anne
Verified User
- Joined
- Dec 3, 2015
- Messages
- 67
Hi,
I keep a close eye on the load of the servers. Therefor I installed the 'load monitor' plugin and that is doing a nice job. However, when I look at that graph, I see some high spikes a couple of times a day. What I don't understand is this. When you click on that spike/time you go to the 'process overview' page of that exact moment.
There I see for example:
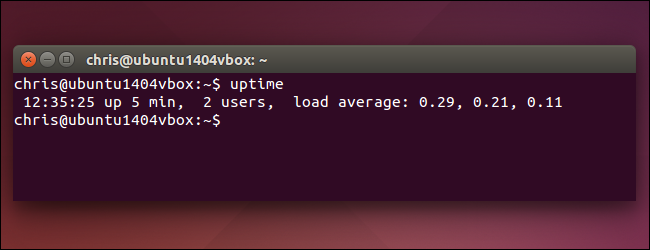
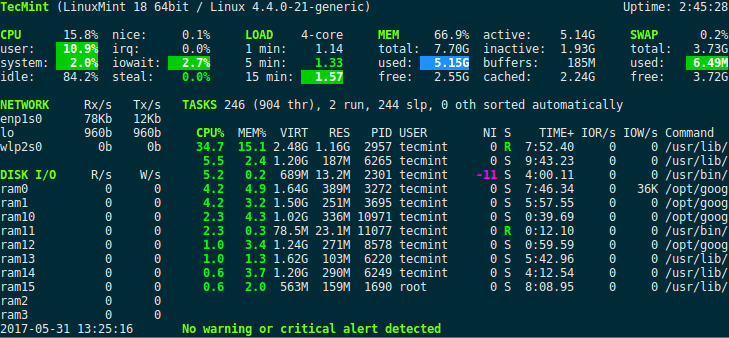
load average: 6.09, 1.27, 0.41
Now this is quite a big spike to me, maybe others are not impressed?
However, in the list below that I see all the processes, but almost all with 0% CPU and say systemd with a 6.2% CPU for example.
Do I misinterpreted the load average? 6.09 does not mean 6.09% but more or less 609% CPU use right?
Why is it than that I don't I see one or more processes that use 100% CPU at that time?
I keep a close eye on the load of the servers. Therefor I installed the 'load monitor' plugin and that is doing a nice job. However, when I look at that graph, I see some high spikes a couple of times a day. What I don't understand is this. When you click on that spike/time you go to the 'process overview' page of that exact moment.
There I see for example:
load average: 6.09, 1.27, 0.41
Now this is quite a big spike to me, maybe others are not impressed?
However, in the list below that I see all the processes, but almost all with 0% CPU and say systemd with a 6.2% CPU for example.
Do I misinterpreted the load average? 6.09 does not mean 6.09% but more or less 609% CPU use right?
Why is it than that I don't I see one or more processes that use 100% CPU at that time?