Max no. of connections DB in directadmin / Debian 10

bcx

Verified User
Joined
Dec 11, 2015
Messages
75
Hi!

I have an unmanged dedicated server:

Fujitsu PRIMERGY RX1330 M4
CPU: Intel Xeon E-2236 3.40GHz
Uplink: 1Gbit/s Premium Netwerk
1Gbit/s up & 1Gbit/s down
Debian 10.x (buster)
16GB ECC DDR4 RAM
120 GB SSD disk

Running my website on wordpress. And after installing a server overview plugin on Wordpress I noticed the following:

  • Database Software : MariaDB
  • Database Version : 10.4.18
  • Maximum No. of Connections : 151
  • Maximum Packet Size : 64 MB
  • Database Disk Usage : 632 MB

On my shared hosting I've installed the same in noticed the Max no. of connections is way higher: 800 !


1. How can I calculate the max connections?
Because after years of managing my own server, I didn't notice this option ever before.
2. I assume the higher this number is the better for site loading? Until a safe value, so the db doesn't crash.
3. Where can I adjust this number? I can't find it on my server.


Thank you in advance.
 
How can I calculate the max connections
General search

The easy way is with mysqltuner. https://github.com/major/MySQLTuner-perl

Some helpful hits on searching

I assume the higher this number is the better for site loading?
No its based on server resources RAM mostly. If you set it to high and you run out of ram server will thrash and maraidb will restart or crash
3. Where can I adjust this number?
Its located in the my.cnf file usually in /etc/

The file may not have any value at all in it which means it using the default.

this general search could help as well
 
Hi There!

Thanks for this info. I'm diving into it. Could this help with the TTFB of a website? Sorry, this is totally new ground for me :) besides the caching, etc.
 
Unless you regularly hit the max number of connections, there is no need to increase it. If you have used them all up, your web application would fail the database connection, and it would (probably) throw an error message. TTFB is not affected directly by this, but of course if you have a lot of ongoing connections to the database, the database might be slower to respond to queries, meaning your TTFB will be longer. Unless your site is extremely busy, or is using a poorly designed database with bad queries, you're probably not going to need even close to 150 connections at the same time.
 
Unless you regularly hit the max number of connections, there is no need to increase it. If you have used them all up, your web application would fail the database connection, and it would (probably) throw an error message. TTFB is not affected directly by this, but of course if you have a lot of ongoing connections to the database, the database might be slower to respond to queries, meaning your TTFB will be longer. Unless your site is extremely busy, or is using a poorly designed database with bad queries, you're probably not going to need even close to 150 connections at the same time.
Yeah I'm having troubles with TTFB. I put one of our website (that i know is bad coded) onto a shared hosting and suddenly and the site opens way faster almost instantly.

I did not expect that so I'm trying to find out what is causing the slow TTFB on my dedicated server.

@bdacus01 i did a test and this is the result.

Code:
-------- Storage Engine Statistics ---------------------------------------------                                                                                                                                                             --------------------
[--] Status: +Aria +CSV +InnoDB +MEMORY +MRG_MyISAM +MyISAM +PERFORMANCE_SCHEMA                                                                                                                                                              +SEQUENCE
[--] Data in Aria tables: 20.6M (Tables: 20)
[--] Data in InnoDB tables: 700.6M (Tables: 548)
[--] Data in MyISAM tables: 691.3M (Tables: 229)
[!!] Total fragmented tables: 1

-------- Analysis Performance Metrics ------------------------------------------                                                                                                                                                             --------------------
[--] innodb_stats_on_metadata: OFF
[OK] No stat updates during querying INFORMATION_SCHEMA.

-------- Security Recommendations ----------------------------------------------                                                                                                                                                             --------------------
[!!] User ''@'localhost' is an anonymous account. Remove with DROP USER ''@'loca                                                                                                                                                             lhost';
[!!] User ''@'srv.mysite.com' is an anonymous account. Remove with DROP US                                                                                                                                                             ER ''@'srv.mysite.com';
[OK] All database users have passwords assigned
[!!] There is no basic password file list!

-------- CVE Security Recommendations ------------------------------------------                                                                                                                                                             --------------------
[--] Skipped due to --cvefile option undefined

-------- Performance Metrics ---------------------------------------------------                                                                                                                                                             --------------------
[--] Up for: 23d 1h 36m 28s (326M q [163.774 qps], 1M conn, TX: 4932G, RX: 40G)
[--] Reads / Writes: 96% / 4%
[--] Binary logging is disabled
[--] Physical Memory     : 15.4G
[--] Max MySQL memory    : 10.3G
[--] Other process memory: 0B
[--] Total buffers: 417.0M global + 66.9M per thread (151 max threads)
[--] P_S Max memory usage: 0B
[--] Galera GCache Max memory usage: 0B
[OK] Maximum reached memory usage: 3.4G (22.13% of installed RAM)
[OK] Maximum possible memory usage: 10.3G (66.61% of installed RAM)
[OK] Overall possible memory usage with other process is compatible with memory                                                                                                                                                              available
[OK] Slow queries: 0% (0/326M)
[OK] Highest usage of available connections: 30% (46/151)
[OK] Aborted connections: 0.00%  (7/1940736)
[!!] name resolution is active : a reverse name resolution is made for each new                                                                                                                                                              connection and can reduce performance
[OK] Query cache is disabled by default due to mutex contention on multiprocesso                                                                                                                                                             r machines.
[OK] Sorts requiring temporary tables: 0% (2K temp sorts / 82M sorts)
[OK] No joins without indexes
[!!] Temporary tables created on disk: 43% (10M on disk / 23M total)
[OK] Thread cache hit rate: 99% (46 created / 1M connections)
[OK] Table cache hit rate: 38% (1K open / 2K opened)
[!!] table_definition_cache(400) is lower than number of tables(958)
[OK] Open file limit used: 2% (688/32K)
[OK] Table locks acquired immediately: 99% (300M immediate / 300M locks)

-------- Performance schema ----------------------------------------------------                                                                                                                                                             --------------------
[--] Performance schema is disabled.
[--] Memory used by P_S: 0B
[--] Sys schema isn't installed.

-------- ThreadPool Metrics ----------------------------------------------------                                                                                                                                                             --------------------
[--] ThreadPool stat is enabled.
[--] Thread Pool Size: 12 thread(s).
[--] Using default value is good enough for your version (10.4.18-MariaDB)

-------- MyISAM Metrics --------------------------------------------------------                                                                                                                                                             --------------------
[!!] Key buffer used: 39.8% (53M used / 134M cache)
[OK] Key buffer size / total MyISAM indexes: 128.0M/66.0M
[OK] Read Key buffer hit rate: 100.0% (28B cached / 27K reads)
[!!] Write Key buffer hit rate: 81.8% (27M cached / 22M writes)

-------- InnoDB Metrics --------------------------------------------------------                                                                                                                                                             --------------------
[--] InnoDB is enabled.
[--] InnoDB Thread Concurrency: 0
[OK] InnoDB File per table is activated
[!!] InnoDB buffer pool / data size: 128.0M/700.6M
[!!] Ratio InnoDB log file size / InnoDB Buffer pool size (75 %): 48.0M * 2/128.                                                                                                                                                             0M should be equal to 25%
[OK] InnoDB buffer pool instances: 1
[--] Number of InnoDB Buffer Pool Chunk : 1 for 1 Buffer Pool Instance(s)
[OK] Innodb_buffer_pool_size aligned with Innodb_buffer_pool_chunk_size & Innodb                                                                                                                                                             _buffer_pool_instances
[OK] InnoDB Read buffer efficiency: 99.24% (10407365935 hits/ 10487437907 total)
[!!] InnoDB Write Log efficiency: 83.42% (23497668 hits/ 28166332 total)
[OK] InnoDB log waits: 0.00% (0 waits / 4668664 writes)

-------- Aria Metrics ----------------------------------------------------------                                                                                                                                                             --------------------
[--] Aria Storage Engine is enabled.
[OK] Aria pagecache size / total Aria indexes: 128.0M/1.7M
[OK] Aria pagecache hit rate: 99.8% (6B cached / 9M reads)

-------- TokuDB Metrics --------------------------------------------------------                                                                                                                                                                                                                                             --------------------
[--] TokuDB is disabled.

-------- XtraDB Metrics --------------------------------------------------------                                                                                                                                                                                                                                             --------------------
[--] XtraDB is disabled.

-------- Galera Metrics --------------------------------------------------------                                                                                                                                                                                                                                             --------------------
[--] Galera is disabled.

-------- Replication Metrics ---------------------------------------------------                                                                                                                                                                                                                                             --------------------
[--] Galera Synchronous replication: NO
[--] No replication slave(s) for this server.
[--] Binlog format: MIXED
[--] XA support enabled: ON
[--] Semi synchronous replication Master: OFF
[--] Semi synchronous replication Slave: OFF
[--] This is a standalone server

-------- Recommendations -------------------------------------------------------                                                                                                                                                                                                                                             --------------------
General recommendations:
    Control warning line(s) into /usr/local/mysql/data/srv.mysite.com.err                                                                                                                                                                                                                                              file
    Control error line(s) into /usr/local/mysql/data/srv.mysite.com.err fi                                                                                                                                                                                                                                             le
    Run OPTIMIZE TABLE to defragment tables for better performance
      OPTIMIZE TABLE `admin_20`.`20_options`; -- can free 162.17277908325                                                                                                                                                                                                                                             2 MB
    Total freed space after theses OPTIMIZE TABLE : 162.172779083252 Mb
    Remove Anonymous User accounts - there are 2 anonymous accounts.
    Configure your accounts with ip or subnets only, then update your configurat                                                                                                                                                                                                                                             ion with skip-name-resolve=1
    When making adjustments, make tmp_table_size/max_heap_table_size equal
    Reduce your SELECT DISTINCT queries which have no LIMIT clause
    Performance schema should be activated for better diagnostics
    Consider installing Sys schema from https://github.com/mysql/mysql-sys for M                                                                                                                                                                                                                                             ySQL
    Consider installing Sys schema from https://github.com/FromDual/mariadb-sys                                                                                                                                                                                                                                              for MariaDB
    Before changing innodb_log_file_size and/or innodb_log_files_in_group read t                                                                                                                                                                                                                                             his: https://bit.ly/2TcGgtU
Variables to adjust:
    tmp_table_size (> 16M)
    max_heap_table_size (> 16M)
    table_definition_cache(400) > 958 or -1 (autosizing if supported)
    performance_schema = ON enable PFS
    innodb_buffer_pool_size (>= 700.6M) if possible.
    innodb_log_file_size should be (=16M) if possible, so InnoDB total log files                                                                                                                                                                                                                                              size equals to 25% of buffer pool size.

For me this is totally new, so I'm not 100% understand everything yet.

But I think I don't reach the max connections yet:
The highest usage of available connections: 30% (46/151)


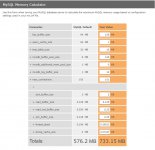
Also based on this calculation: I only have max 40 connections.. although I have 16 GB of ram. and in the example on this website
https://www.geekdecoder.com/calculate-mysql-max_connections-variable/ they have less ram :s


In my phpMyAdmin -> Variables I found the numbers to calculate the max connections and for the image below.
 

Attachments

  • 2021-04-08_16-42-28.jpg
    2021-04-08_16-42-28.jpg
    105.1 KB · Views: 13
Last edited:
set in /etc/my.cnf
tmp_table_size=128m
max_heap_table_size=128m
table_definition_cache=1000
innodb_buffer_pool_size=1g
restart mysql, wait 10-20 minutes and check site speed again
also if you have myisam data too - you can try to enable query cache, or convert tables to innodb (if treir content support it)
 
  • Like
Reactions: bcx
set in /etc/my.cnf
tmp_table_size=128m
max_heap_table_size=128m
table_definition_cache=1000
innodb_buffer_pool_size=1g
restart mysql, wait 10-20 minutes and check site speed again
also if you have myisam data too - you can try to enable query cache, or convert tables to innodb (if treir content support it)
Thank you for your help!
I logged into root went to /etc/my.cnf and this is what's currently listed into that file:
Code:
[mysqld]
max_allowed_packet=64M
local-infile=0
innodb_file_per_table

[client]
socket=/usr/local/mysql/data/mysql.sock

I need to change it to the following? :

Code:
[mysqld]
max_allowed_packet=64M
local-infile=0
innodb_file_per_table
tmp_table_size=128m
max_heap_table_size=128m
table_definition_cache=1000
innodb_buffer_pool_size=1g
[client]
socket=/usr/local/mysql/data/mysql.sock
 
Back
Top