Server load

adriangrz

Verified User
Joined
Mar 23, 2021
Messages
60
Hi,
my server while in admin backup is in progress has huge CPU load. Why it goes like this?
I saw that when backup comes to go then my websites are offline - like apache is overloaded by backup process?
Please let me know what to do to aviod this case in future.
Regards,
Adrian
 

Attachments

  • server load 2024-05-20_09h38_57.png
    server load 2024-05-20_09h38_57.png
    129.5 KB · Views: 19
On your screen only one core loaded to 85% all other free. Total load about 5%
On linux systems 100% process usage shows 1 fully loaded core, so sometimes you can see 800% and other digits that show you that this process using 8 cores now. At higher part you see your cores/threads 0-11 - total 12, and they almost free.
LoadAverage 12 - this not updated instantly, it shows average load past 1/5/15 minutes.
 
Thank you for explanation of this case. Im worrying beasuse when this happens my mysql is overloaded, websites (mostly CMS) are down. How can I prevent this case in future? How to optimize mysql in this case?
I also looked that it was probably of one user who had malwared website on my server. I suspended this user, killed this cpu-eating PID, and server came back to performance before.
What you will suggest to do to prevent this in future?
 
and what are these letters in table?
 

Attachments

  • 2024-05-21_14h02_55.png
    2024-05-21_14h02_55.png
    94.8 KB · Views: 12

Detailed Processes Information in htop

  • PID – It describes the Process ID number.
  • USER – It describes the process owner.
  • PRI – It describes the process priority as viewed by the Linux kernel.
  • N – It describes the process priority reset by the user or root.
  • VIR – It describes the virtual memory that a process is consuming.
  • RES – It describes the physical memory that a process is consuming.
  • SHR – It describes the shared memory that a process is consuming.
  • S – It describes the current state of a process.
  • CPU% – It describes the percentage of CPU consumed by each process.
  • MEM% – It describes the percentage of Memory consumed by each process.
  • TIME+ – It displays the time since process execution has started.
  • Command – It displays the full command execution in parallel to each process.
1716297138333.png
 
that means your users probably are doing mysql processes, and that's why mysql is using CPU.

that's pretty normal.
 
you can run mysqltuner to check if your mysql config optimal and what you can optimize.
also you can enable opcache - it helps with WP too.
 
Hello,

Thank you for explanation of this case. Im worrying beasuse when this happens my mysql is overloaded, websites (mostly CMS) are down. How can I prevent this case in future? How to optimize mysql in this case?

PHP sites might become down because of MySQL in a case when a MySQL limit max-connections is hit. For security and performance reasons a SQL server has a limit on number of active concurrent connections to it. And when a limit is reached, new connections are dropped and PHP sites are generating a 5xx error.

You might check MySQL and/or system logs for 'Too many connections' lines.

You might check Apache/Nginx/(open)LiteSpeed logs for possible lines mentioning 'max_user_connections'.

And even install mysqltuner.pl and run:

Code:
mysqltuner.pl | egrep --color "Highest usage of available connections"

By the way it is normal to see that a mysqld process is long-running. There is actually no reason to restart it unless you upgrade the server version.

Then a question might come: Why do I have so many connections to a SQL server?

There might be numerous reasons of it, the most common might be the following:

Tables are locked and new connections are waiting an access to a table.

And they might be locked for other reasons:

1. sites are running heavy SQL queries.
2. tables are missing INDEXES.
3. sites are under attack from bots, vulnerability scanners, etc.
4. mysql table optimization is running
5. sql dumps are being created
6. misc.

And before doing an optimization you might understand the reasons of the incident.

p.s. And whenever you face an issue with SQL, you might see another issue: reached max_children in PHP-FPM.

Check PHP-FPM logs for lines 'reached max_children'. Of course if you run PHP-FPM.

If it is too complicated or too much information feel free to ask questions or hire me for this job.
 

Detailed Processes Information in htop

  • PID – It describes the Process ID number.
  • USER – It describes the process owner.
  • PRI – It describes the process priority as viewed by the Linux kernel.
  • N – It describes the process priority reset by the user or root.
  • VIR – It describes the virtual memory that a process is consuming.
  • RES – It describes the physical memory that a process is consuming.
  • SHR – It describes the shared memory that a process is consuming.
  • S – It describes the current state of a process.
  • CPU% – It describes the percentage of CPU consumed by each process.
  • MEM% – It describes the percentage of Memory consumed by each process.
  • TIME+ – It displays the time since process execution has started.
  • Command – It displays the full command execution in parallel to each process.
View attachment 8030
Ok, but in my case in process state column I have "D" letter, what it means?
 
Ok, but in my case in process state column I have "D" letter, what it means?
Quote from site https://peteris.rocks/blog/htop/

//

D - uninterruptible sleep (usually IO)​

Unlike interruptible sleep, you cannot wake up this process with a signal.That is why many people dread seeing this state.You can't kill such processes because killing means sending SIGKILL signals to processes.

This state is used if the process must wait without interruptionor when the event is expected to occur quickly.Like reading to/from a disk.But that should only happen for a fraction of a second.

Here is a nice answer on StackOverflow.

Uninterruptable processes are USUALLY waiting for I/O following a page fault.The process/task cannot be interrupted in this state, because it can't handle any signals;if it did, another page fault would happen and it would be back where it was.

In other words, this could happen if you are using Network File System (NFS)and it takes a while to read and write from it.
Or in my experience it can also mean that some of the processes are swapping a lotwhich means you have too little available memory.
//
 
Hello,


PHP sites might become down because of MySQL in a case when a MySQL limit max-connections is hit. For security and performance reasons a SQL server has a limit on number of active concurrent connections to it. And when a limit is reached, new connections are dropped and PHP sites are generating a 5xx error.

You might check MySQL and/or system logs for 'Too many connections' lines.

You might check Apache/Nginx/(open)LiteSpeed logs for possible lines mentioning 'max_user_connections'.

And even install mysqltuner.pl and run:

Code:
mysqltuner.pl | egrep --color "Highest usage of available connections"

By the way it is normal to see that a mysqld process is long-running. There is actually no reason to restart it unless you upgrade the server version.

Then a question might come: Why do I have so many connections to a SQL server?

There might be numerous reasons of it, the most common might be the following:

Tables are locked and new connections are waiting an access to a table.

And they might be locked for other reasons:

1. sites are running heavy SQL queries.
2. tables are missing INDEXES.
3. sites are under attack from bots, vulnerability scanners, etc.
4. mysql table optimization is running
5. sql dumps are being created
6. misc.

And before doing an optimization you might understand the reasons of the incident.

p.s. And whenever you face an issue with SQL, you might see another issue: reached max_children in PHP-FPM.

Check PHP-FPM logs for lines 'reached max_children'. Of course if you run PHP-FPM.

If it is too complicated or too much information feel free to ask questions or hire me for this job.
I put mysqltuner into action, I have report like below (what do you recommend to change and where? ) :


-------- Recommendations ---------------------------------------------------------------------------
General recommendations:
Remove Anonymous User accounts: there are 2 anonymous accounts.
MySQL was started within the last 24 hours: recommendations may be inaccurate
Configure your accounts with ip or subnets only, then update your configuration with skip-name-resolve=ON
We will suggest raising the 'join_buffer_size' until JOINs not using indexes are found.
See https://dev.mysql.com/doc/refman/8.0/en/server-system-variables.html#sysvar_join_buffer_size
When making adjustments, make tmp_table_size/max_heap_table_size equal
Reduce your SELECT DISTINCT queries which have no LIMIT clause
Performance schema should be activated for better diagnostics
MyISAM engine is deprecated, consider migrating to InnoDB
Be careful, increasing innodb_log_file_size / innodb_log_files_in_group means higher crash recovery mean time
Variables to adjust:
skip-name-resolve=ON
join_buffer_size (> 256.0K, or always use indexes with JOINs)
tmp_table_size (> 16M)
max_heap_table_size (> 16M)
table_definition_cache (400) > 8363 or -1 (autosizing if supported)
performance_schema=ON
key_buffer_size (~ 25M)
innodb_buffer_pool_size (>= 4.8G) if possible.
innodb_log_file_size should be (=32M) if possible, so InnoDB total log file size equals 25% of buffer pool size.
innodb_log_buffer_size (> 16M)
 
I put mysqltuner into action, I have report like below (what do you recommend to change and where? ) :

That won't work this way. I won't provide bare figures without knowing a source of an issue. If you want to play with MySQL optimization you'd better start with reading existing threads and official docs. There are topics on these forums which really worth an attention.

- https://www.google.com/search?q=site:directadmin.com+mysql+optimization
- https://docs.directadmin.com/
- https://www.google.com/search?q=mysql+optimization+site:https://dev.mysql.com
 
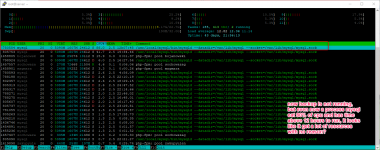
I have more detailed report od mysqltuner, if you can look at it and just tell your first conclusion what to check on first sight, I will be very grateful.

root@server ~ # ./mysqltuner.pl
>> MySQLTuner 2.5.3
* Jean-Marie Renouard <[email protected]>
* Major Hayden <[email protected]>
>> Bug reports, feature requests, and downloads at http://mysqltuner.pl/
>> Run with '--help' for additional options and output filtering

[--] Skipped version check for MySQLTuner script
[OK] Operating on 64-bit architecture

-------- Storage Engine Statistics ------------------------------------------------------------- ----
[--] Status: +Aria +CSV +InnoDB +MEMORY +MRG_MyISAM +MyISAM +PERFORMANCE_SCHEMA +SEQUENCE
[--] Data in Aria tables: 32.0K (Tables: 1)
[--] Data in MyISAM tables: 107.4M (Tables: 424)
[--] Data in MEMORY tables: 0B (Tables: 15)
[--] Data in InnoDB tables: 4.8G (Tables: 7632)
[OK] Total fragmented tables: 0

[OK] Currently running supported MySQL version 10.6.17-MariaDB

-------- Log file Recommendations -------------------------------------------------------------- ----
[!!] Log file doesn't exist

-------- Analysis Performance Metrics ---------------------------------------------------------- ----
[--] innodb_stats_on_metadata: OFF
[OK] No stat updates during querying INFORMATION_SCHEMA.

-------- Views Metrics ------------------------------------------------------------------------- ----

-------- Triggers Metrics ---------------------------------------------------------------------- ----

-------- Routines Metrics ---------------------------------------------------------------------- ----

-------- Security Recommendations -------------------------------------------------------------- ----
[!!] User ''@'localhost' is an anonymous account. Remove with DROP USER ''@'localhost';
[!!] User ''@'server' is an anonymous account. Remove with DROP USER ''@'s erver-IP.da.direct';
[OK] All database users have passwords assigned
[--] There are 620 basic passwords in the list.

-------- CVE Security Recommendations ---------------------------------------------------------- ----
[OK] NO SECURITY CVE FOUND FOR YOUR VERSION

-------- Performance Metrics ------------------------------------------------------------------- ----
[--] Up for: 22h 56m 57s (17M q [215.357 qps], 142K conn, TX: 124G, RX: 3G)
[--] Reads / Writes: 98% / 2%
[--] Binary logging is disabled
[--] Physical Memory : 62.7G
[--] Max MySQL memory : 861.2M
[--] Other process memory: 0B
[--] Total buffers: 417.0M global + 2.9M per thread (151 max threads)
[--] Performance_schema Max memory usage: 0B
[--] Galera GCache Max memory usage: 0B
[OK] Maximum reached memory usage: 517.0M (0.81% of installed RAM)
[OK] Maximum possible memory usage: 861.2M (1.34% of installed RAM)
[OK] Overall possible memory usage with other process is compatible with memory available
[OK] Slow queries: 0% (23K/17M)
[OK] Highest usage of available connections: 22% (34/151)
[OK] Aborted connections: 0.00% (7/142143)
[!!] Name resolution is active: a reverse name resolution is made for each new connection which can reduce performance
[OK] Query cache is disabled by default due to mutex contention on multiprocessor machines.
[OK] Sorts requiring temporary tables: 0% (840 temp sorts / 2M sorts)
[!!] Joins performed without indexes: 115233
[!!] Temporary tables created on disk: 27% (528K on disk / 1M total)
[OK] Thread cache hit rate: 99% (34 created / 142K connections)
[OK] Table cache hit rate: 91% (24M hits / 27M requests)
[!!] table_definition_cache (400) is less than number of tables (8363)
[OK] Open file limit used: 0% (248/32K)
[OK] Table locks acquired immediately: 99% (632K immediate / 632K locks)

-------- Performance schema -------------------------------------------------------------------- ----
[!!] Performance_schema should be activated.
[--] Sys schema is installed.

-------- ThreadPool Metrics -------------------------------------------------------------------- ----
[--] ThreadPool stat is disabled.

-------- MyISAM Metrics ------------------------------------------------------------------------ ----
[!!] Consider migrating 424 following tables to InnoDB:
[--] * InnoDB migration request for testowy_spes.wpuo_usermeta Table: ALTER TABLE testowy_spes.w puo_usermeta ENGINE=InnoDB;
[--] * InnoDB migration request for testowy_spes.wpuo_postmeta Table: ALTER TABLE testowy_spes.w puo_postmeta ENGINE=InnoDB;
[--] * InnoDB migration request for testowy_spes.wpuo_links Table: ALTER TABLE testowy_spes.wpuo _links ENGINE=InnoDB;
[--] * InnoDB migration request for testowy_spes.wpuo_term_relationships Table: ALTER TABLE test owy_spes.wpuo_term_relationships ENGINE=InnoDB;
[--] * InnoDB migration request for testowy_spes.wpuo_options Table: ALTER TABLE testowy_spes.wp uo_options ENGINE=InnoDB;
[--] * InnoDB migration request for testowy_spes.wpuo_terms Table: ALTER TABLE testowy_spes.wpuo _terms ENGINE=InnoDB;
[--] * InnoDB migration request for testowy_spes.wpuo_users Table: ALTER TABLE testowy_spes.wpuo _users ENGINE=InnoDB;
[--] * InnoDB migration request for testowy_spes.wpuo_comments Table: ALTER TABLE testowy_spes.w puo_comments ENGINE=InnoDB;
[--] * InnoDB migration request for testowy_spes.wpuo_posts Table: ALTER TABLE testowy_spes.wpuo _posts ENGINE=InnoDB;
[--] * InnoDB migration request for testowy_spes.wpuo_term_taxonomy Table: ALTER TABLE testowy_s pes.wpuo_term_taxonomy ENGINE=InnoDB;
[--] * InnoDB migration request for testowy_spes.wpuo_commentmeta Table: ALTER TABLE testowy_spe s.wpuo_commentmeta ENGINE=InnoDB;
[--] * InnoDB migration request for tomsyl_ts.wp_comments Table: ALTER TABLE ENG INE=InnoDB;
a lot of THIS ...........

NGINE=InnoDB;
[--] General MyIsam metrics:
[--] +-- Total MyISAM Tables : 424
[--] +-- Total MyISAM indexes : 11.3M
[--] +-- KB Size :128.0M
[--] +-- KB Used Size :24.4M
[--] +-- KB used :19.1%
[--] +-- Read KB hit rate: 99.8% (8M cached / 17K reads)
[--] +-- Write KB hit rate: 91.9% (27K cached / 25K writes)
[!!] Key buffer used: 19.1% (24.4M used / 128.0M cache)
[OK] Key buffer size / total MyISAM indexes: 128.0M/11.3M
[OK] Read Key buffer hit rate: 99.8% (8M cached / 17K reads)
[!!] Write Key buffer hit rate: 91.9% (27K cached / 25K writes)

-------- InnoDB Metrics ------------------------------------------------------------------------ ----
[--] InnoDB is enabled.
[OK] InnoDB File per table is activated
[OK] InnoDB Buffer Pool size ( 128.0M ) under limit for 64 bits architecture: (17179869184.0G )
[!!] InnoDB buffer pool / data size: 128.0M / 4.8G
[!!] Ratio InnoDB log file size / InnoDB Buffer pool size (75%): 96.0M * 1 / 128.0M should be eq ual to 25%
[--] Number of InnoDB Buffer Pool Chunk: 1 for 1 Buffer Pool Instance(s)
[OK] Innodb_buffer_pool_size aligned with Innodb_buffer_pool_chunk_size & Innodb_buffer_pool_ins tances
[!!] InnoDB Read buffer efficiency: 89.45% (1556898617 hits / 1740432654 total)
[!!] InnoDB Write Log efficiency: 65.47% (507119 hits / 774563 total)
[OK] InnoDB log waits: 0.00% (0 waits / 267444 writes)

-------- Aria Metrics -------------------------------------------------------------------------- ----
[--] Aria Storage Engine is enabled.
[OK] Aria pagecache size / total Aria indexes: 128.0M/368.0K
[!!] Aria pagecache hit rate: 93.3% (5M cached / 353K reads)

-------- TokuDB Metrics ------------------------------------------------------------------------ ----
[--] TokuDB is disabled.

-------- XtraDB Metrics ------------------------------------------------------------------------ ----
[--] XtraDB is disabled.

-------- Galera Metrics ------------------------------------------------------------------------ ----
[--] Galera is disabled.

-------- Replication Metrics ------------------------------------------------------------------- ----
[--] Galera Synchronous replication: NO
[--] No replication slave(s) for this server.
[--] Binlog format: MIXED
[--] XA support enabled: ON
[--] Semi synchronous replication Master: OFF
[--] Semi synchronous replication Slave: OFF
[--] This is a standalone server

-------- Recommendations ----------------------------------------------------------------------- ----
General recommendations:
Remove Anonymous User accounts: there are 2 anonymous accounts.
MySQL was started within the last 24 hours: recommendations may be inaccurate
Configure your accounts with ip or subnets only, then update your configuration with skip-na me-resolve=ON
We will suggest raising the 'join_buffer_size' until JOINs not using indexes are found.
See https://dev.mysql.com/doc/refman/8.0/en/server-system-variables.html#sysvar_joi n_buffer_size
When making adjustments, make tmp_table_size/max_heap_table_size equal
Reduce your SELECT DISTINCT queries which have no LIMIT clause
Performance schema should be activated for better diagnostics
MyISAM engine is deprecated, consider migrating to InnoDB
Be careful, increasing innodb_log_file_size / innodb_log_files_in_group means higher crash r ecovery mean time
Variables to adjust:
skip-name-resolve=ON
join_buffer_size (> 256.0K, or always use indexes with JOINs)
tmp_table_size (> 16M)
max_heap_table_size (> 16M)
table_definition_cache (400) > 8363 or -1 (autosizing if supported)
performance_schema=ON
key_buffer_size (~ 25M)
innodb_buffer_pool_size (>= 4.8G) if possible.
innodb_log_file_size should be (=32M) if possible, so InnoDB total log file size equals 25% of buffer pool size.
innodb_log_buffer_size (> 16M)
 
tmp_table_size = 256M
max_heap_table_size = 256M
table_definition_cache = 10000
key_buffer_size = 32M
innodb_buffer_pool_size = 6G
innodb_log_file_size should be = 256M
 
For MySQL / MariaDB, you may run the following to monitor which SQL statement is running long ...

Code:
watch -n 1 "uptime; echo 'show full processlist;' | mysql --defaults-extra-file=/usr/local/directadmin/conf/my.cnf"

---

For backup I/O process, you may use ionice -c 3 -p <PID> to change process I/O priority from best-effort to idle
 
tmp_table_size = 256M
max_heap_table_size = 256M
table_definition_cache = 10000
key_buffer_size = 32M
innodb_buffer_pool_size = 6G
innodb_log_file_size should be = 256M
where should I write this settings?
/etc/my.cnf
or
/usr/local/directadmin/conf/my.cnf
or else?
 
For MySQL / MariaDB, you may run the following to monitor which SQL statement is running long ...

Code:
watch -n 1 "uptime; echo 'show full processlist;' | mysql --defaults-extra-file=/usr/local/directadmin/conf/my.cnf"

---

For backup I/O process, you may use ionice -c 3 -p <PID> to change process I/O priority from best-effort to idle
some processes are constantly showing (these marked in red) - why? , other are working normally
 

Attachments

  • 2024-05-23_19h26_18.png
    2024-05-23_19h26_18.png
    84.7 KB · Views: 12
some processes are constantly showing (these marked in red) - why? , other are working normally


Check the webserver logs. The user's site might be of a higher interest from either bots/search engines or regular users.
 
Back
Top